IA-007 / 2019
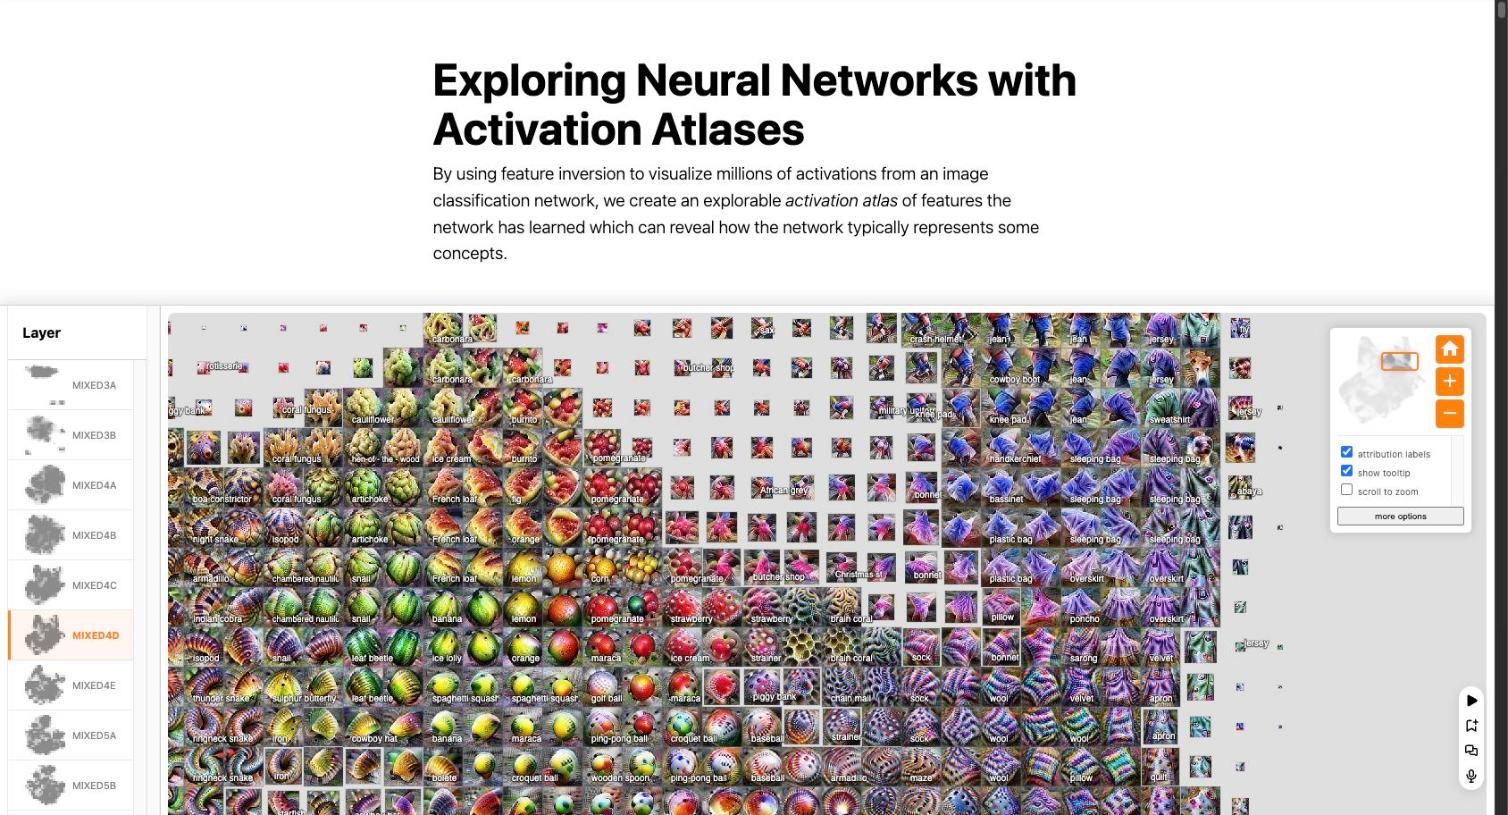
Activation Atlas is a scatter plotA graph where each point represents a pair of values, showing the relationship between two sets of numbers on a coordinate plane.A graph of paired numerical values, with one variable on the horizontal axis and the corresponding value of a second variable on the vertical axis, used to reveal relationships or association between the variables.glossary and an activation gridLots of tiny pictures in a grid, each showing what the model saw at that spot.Many small images laid out in a grid, each one standing for what a part of the model responded to at that position.glossary showing featuresA single thing the model has learned to recognise, like a place, a tone of voice, or a kind of mistake.Individual learned directions or concepts inside the model.glossary, about feature-interpretationWorking out what one small piece of the model has learned to recognise.What an individual learned feature means.glossary.
- ID
- IA-007
- Name
- Activation Atlas
- Artefact type
- Interactive article
- Visual form
- Scatter plotA graph where each point represents a pair of values, showing the relationship between two sets of numbers on a coordinate plane.A graph of paired numerical values, with one variable on the horizontal axis and the corresponding value of a second variable on the vertical axis, used to reveal relationships or association between the variables.glossaryActivation gridLots of tiny pictures in a grid, each showing what the model saw at that spot.Many small images laid out in a grid, each one standing for what a part of the model responded to at that position.glossary
- Makes visible
- FeaturesA single thing the model has learned to recognise, like a place, a tone of voice, or a kind of mistake.Individual learned directions or concepts inside the model.glossary
- Role of the visual
- Finding
- Runnable by a visitor
- Pre-rendered, view only
- Date published
- 2019-03-06
- Year
- 2019
- Link status
- Live
- Built by (people)
- Shan Carter; Zan Armstrong; Ludwig Schubert; Ian Johnson; Chris Olah
- Organisation
- Google Brain; OpenAI
- Venue / published in
- Distill
- Sector
- Frontier lab
- Country / region
- US
- Open source
- Unknown
- Method / technique
- Feature inversion applied to millions of averaged activations, laid out as a navigable two-dimensional map
- Model(s) studied
- InceptionV1 / GoogLeNet
- Access required
- Open weights
- What it visualises
- A navigable map of what a vision classifier has learned — millions of activations rendered as feature-inversion images and arranged so that nearby regions are semantically related
- Interaction affordances
- Pan and zoom across the atlas; switch layer; filter by class
- Pragmatic vs Basic science
- Basic science
- Reverse-eng vs Concept-based
- Reverse-engineering
- Observational vs Interventional
- Observational
- Intended audience
- Researchers; General public
- Description (card)
- Renders millions of activations from an image classifier as feature-inversion images laid out on a single navigable map, so you can pan across the concepts a network has learned the way you would read an atlas.
- Why it matters
- Made a model's whole learned concept space visible at once rather than one neuron at a time — the clearest ancestor of the feature-neighbourhood maps in Scaling Monosemanticity.
- Visual / design notes
- Pan-and-zoom over a dense image grid. Still the most immediately arresting object the field has produced, and the reason 'atlas' is a live metaphor in interpretability at all — including in this project's title.
- Tags
- modality:visionImages. Models that look at pictures.Models that process static images.glossarymethod:feature-visualisationGenerating an image that shows what a part of the model responds to most strongly.Synthesising an input that maximally activates a chosen component.glossarymethod:dimensionality-reductionFlattening very high-dimensional data down to two or three dimensions so it can be drawn.Projecting high-dimensional activations into two or three dimensions so their structure can be seen.glossaryphenomenon:feature-interpretationWorking out what one small piece of the model has learned to recognise.What an individual learned feature means.glossary
- Thumbnail URL
- https://distill.pub/2019/activation-atlas/thumbnail.jpg
- Media files
- IA-007-activation-atlas--global-mixed4d--2026-08-12.jpg
- Citation
- Carter, S., Armstrong, Z., Schubert, L., Johnson, I. and Olah, C., 2019. Activation Atlas. Distill. DOI 10.23915/distill.00015
- Related entries
- IA-001; IA-003
- Confidence
- High
- Source of info
- Read the Distill article and its citation metadata, 2026-08-06
- Date added
- 2026-08-06
- Added by
- Claude
- Notes
- Open source status not verified — the article references code but this was not confirmed, so the field is left Unknown rather than guessed.